Smart Farm Mobile Applications
Our mobile apps are very easy to use and are compatible with Apple iOS and most Android mobile devices. You can view the following information by pressing device specific buttons:
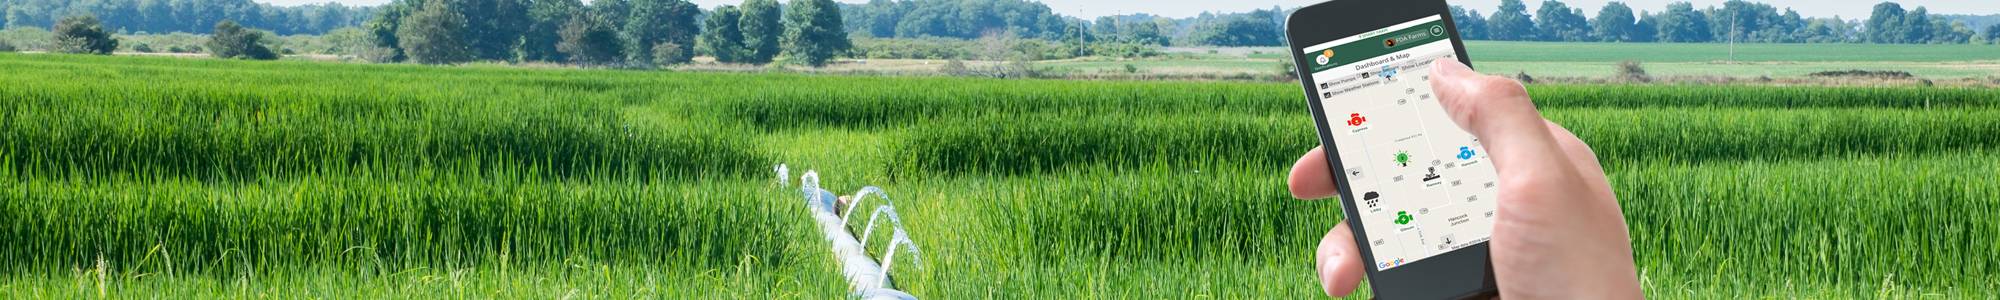
Dashboard & Map
During the farm site survey we capture a Google Earth image of your entire farm. We then place icons on that image to indicate the type and location of each device. At a glance you can see the operation status of all Smart Farm monitored devices. Color coded icons indicate active, inactive and off line states as well as equipment faults. You can navigate around the map, zoom in on a single device, touch the icon and see detailed information on it.

Weather Station
The Smart Farm weather station includes the following sensors which can be monitored from our mobile and desktop apps:
- Rain accumulator
- Ambient Temperature
- Humidity
- Wind Speed and Direction
- Solar Radiation
With these sensors we can also calculate and show:
- Daily, weekly and season total rainfall
- Dew Point
- Evapotranspiration Rate
- Growth Degree Days
We display a list view of all weather stations installed on the farm when you press the weather button. You can easily sort the station list based on min and max rain levels, temperature, humidity, dew point, wind speed, solar radiation and evapotranspiration rates.
The data graph portion of our display can also show any or all data trends from these sensors, by the day, week or month.

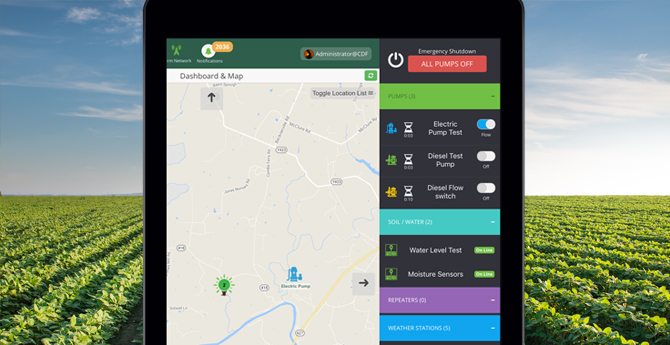
Pump Status
Our pump status list shows pump type, name and location, activity status, run time, automation options, fault and fuel level status if applicable. You can sort by any category in the list (for example, always show all pumps currently running, or sort those with the lowest fuel levels to the top of the list)
Open up a pump graph and you can look at trend lines associated with well flow rate, RPM, fuel level and battery voltage (if connected to a diesel pump), weather station data from nearby weather stations and fault event timing.
Soil Moisture Level
Our soil moisture status list displays location, growth degree days, rain levels and individual moisture probe levels. You can also sort by any of those categories in the list show the lowest moisture probe levels at the top of the list for example.
The soil moisture graph shows trend lines associated with soil monitoring probes and rain levels of nearby weather stations.
Water Level
Rice field water levels can be displayed when using the Smart Farm water level probes. In the water level list view we provide location, growth degree days, rain levels and individual water level meter readings. You can also sort by any of those categories in the list, for example, show the lowest rice field water levels at the top of the list.
The water level graph shows trend lines associated with each water level meter and rain levels of nearby weather stations.
Automation & Triggers
We provide an intuitive, easy to use, easy to change automation interface. Our approach creates a step-by-step process for the farm operator to implement based on the following logic:
- When something we are monitoring
- Is greater than, less than, equal to or not equal to
- An operator-specified condition
- Then take a certain action
- At a certain or all pumps
The user interface allows you to select a sensor to monitor, define the threshold and condition, what action to take at what pumps.
For example, when a weather station rain gauge has accumulated 1” of rain that day turn the pump off and send an alert to the farmer. Or, if the fuel level in a diesel pump tank gets below 25% send an alert to the farmer.
The following monitored conditions can trigger an event:
- A simple timer
- A date and time alarm clock
- Rainfall at a weather station
- Water flow rate
- Diesel engine RPM
- Fuel level
- Fuel tamper (meaning a rapid drop in fuel level)
- Diesel pump battery voltage
- Pump or monitoring node performance parameters
- Moisture probe levels
- Water meter levels
- Wind speed
- Temperature
- Humidity
- Pump shutdown fault
- Moisture or water level probe fault
- Maintenance alert
Actions than can be taken based on an event trigger (at this time)
Turn on or off an electric pump, turn off a diesel pump
Send an alert message to the operator
Maintenance
Our system keeps track of the accumulated run time at every pump and can send alerts when farmer-defined maintenance tasks need to be completed. The maintenance tasks we track include grease fittings, change oil and oil filter, change air filter and monitor fuel levels.
Any of those categories can be selected and sorted so that pump locations that require preventative immediate maintenance tasks are sorted to the top of the list.
We also provide a dropdown maintenance log showing work done, date and name of the individual who did the service and how many hours remain until the next service event.
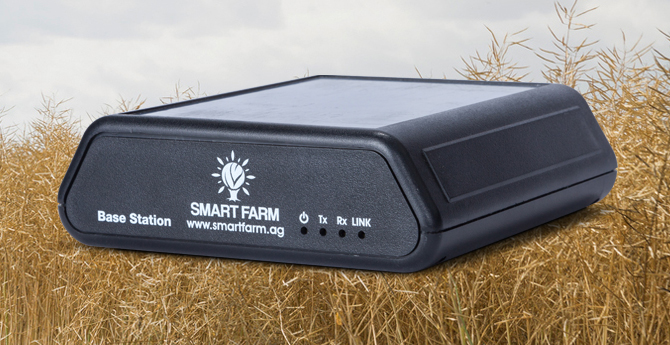
Smart Node Status
We provide a status view for Smart Farm equipment as well. The list view displays node type, name and location, activity status, internal temperature, ambient temperature of a nearby weather station, communication link latency and internal battery voltage. You can also sort by any category in the list (for example, always show all pumps with high communication link latencies at the top of the list)
Open up a smart node graph and you can look at trend lines associated all the data points shown in the status view.
